The Essential Guide to Assisted Conversions in GA4
Do you know it’s time to say goodbye to Google’s Universal Analytics?
Yes, that’s right.
From July 2023, Google is no longer processing data in Universal Analytics, and users must make the move to Google Analytics 4 (GA4).
Today, I want to talk about one specific area of GA4: assisted conversions.
In this blog, you’ll learn what assisted conversions are, which metrics matter, the best practices to apply, and how to leverage GA4 for optimization.
Get ready to elevate your tracking expertise and make smarter decisions to supercharge your website’s performance.
Let’s go.
What Are Assisted Conversions?
Assisted conversions refer to the interactions or touchpoints along the customer journey that contribute to a conversion.
For example, a user might find your website through a social media post or ad. Later, they click on a Google search ad, and finally, they convert by making a purchase.
The social media ad and the Google search ad both assist in the conversion process.
How does viewing these touchpoints help you as a marketer?
You can see which of your marketing channels are the most effective for assisting conversions and identify the final touchpoint. Then, you can use this information to adapt your marketing strategy and adjust your budget for the best ROI.
That’s pretty good, huh?
I certainly think so.
However, you don’t want to get lost in the overwhelm of all those metrics. You need to focus on the key metrics under assisted conversions.
Key Metrics and Reports for Assisted Conversions
Let’s review the essential metrics and reports that help you understand how your various marketing channels, campaigns, or even specific pages on your site work together to lead users to that ultimate conversion.
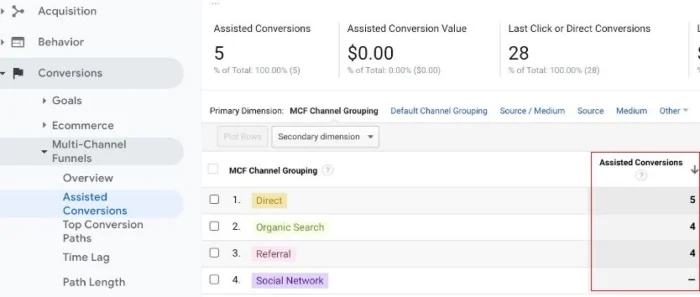
Assisted Conversion Report
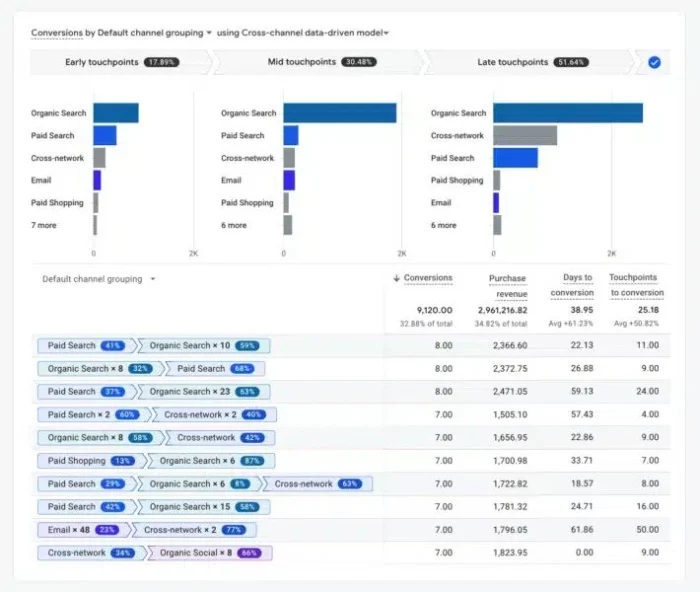
The assisted conversion report maps the impact and contribution of different marketing channels and touchpoints along your customers’ conversion journey.
Remember the assisted conversions I talked about earlier? Like your social media posts and Google Ads? The assisted conversion report tracks these.
It’s sort of like having a trail of breadcrumbs that leads you to understand which channels played a supportive role in driving conversions.
It includes these metrics:
- Conversions
- Purchase revenue
- Days to conversion
- Touchpoints to conversion
It also gives you data visualizations to view the early, mid, and late touchpoints that make up the assisted conversion.
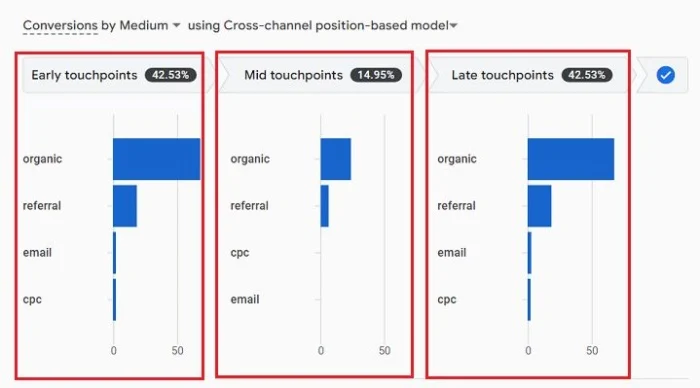
You can customize and filter results for more precise data to find exactly what you want.
If you’re a marketer making data-driven decisions and want to unravel the complexities of your customers’ paths to conversion, the assisted conversions report in GA4 should be your first stop. To access this data, follow these steps:
- Log into your Google Analytics 4 (GA4) property.
- Select “Analysis” from the left-hand menu.
- Click on “Conversions” from the drop-down menu to view the different conversions reports.
- Choose “Assisted Conversions” to view the report showing the different touchpoints contributing to conversions and conversion paths.
Top Conversion Path Report
Do you ever wish you had more insights into the steps that lead to a conversion? Well, you’re in luck!
That’s where the top conversion path report in Google Analytics 4 comes in.
This report highlights data like ad clicks, email opens, and organic research results. When you put it all together, this assisted conversions report provides insights into how different channels contribute to conversions by showing the number of assisted conversions and their value for each channel.
This lets you measure the effectiveness of your marketing efforts across your various channels and how they work together to drive conversions.
You can find it in the “conversions” tab by selecting “multi-channel reporting.” Click on that, and you’ll get a page that looks like this:
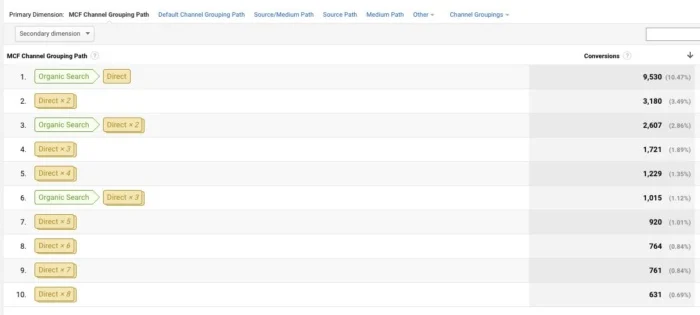
You can also filter these results to see your organic and paid traffic.
Assisted Conversions by Channel Report
The report breaks down your marketing channels into various categories.
That includes channels like:
- organic search
- paid search
- social media
- direct
- referral, and more.
There are several ways you can use this assisted conversions feature to enhance your online strategy. For example, let’s say you’re aiming to improve customer experience. You could:
- Leverage data from the assisted conversions by channel report to better understand how your customers find you at the various stages of their customer services journey. This way, you get to see how customers discover and interact with your business at every point of their journey, you can then tailor this experience to better suit their needs.
- View the channel report for a comprehensive view of your marketing efforts. This helps you find the channels that support conversions throughout your entire funnel.
- Check if certain channels have multiple assisted conversions. This shows they are acting as valuable touchpoints. You can then use this information to reallocate resources to the channels bringing in the most value.
You can find this report by selecting “Conversions” from the left hand menu under GA4’s “Reporting” tab, then click “Multi Channel Funnels,” followed by “Assisted Conversions.”
Time Lag Report
How long does it take between a customer’s first interaction with your brand and conversion? For example, let’s say a customer first interacts with your brand by clicking on a Facebook Ad, but does not make a purchase. Several days later, they see a Google Search Ad and decide to visit your website to learn more about you. Maybe later on that day, they return to your website from a direct search and make a purchase.
The Facebook and Google Search Ads are examples of assisted conversions, whereby the number of days it took for the customer conversion is the time lag.
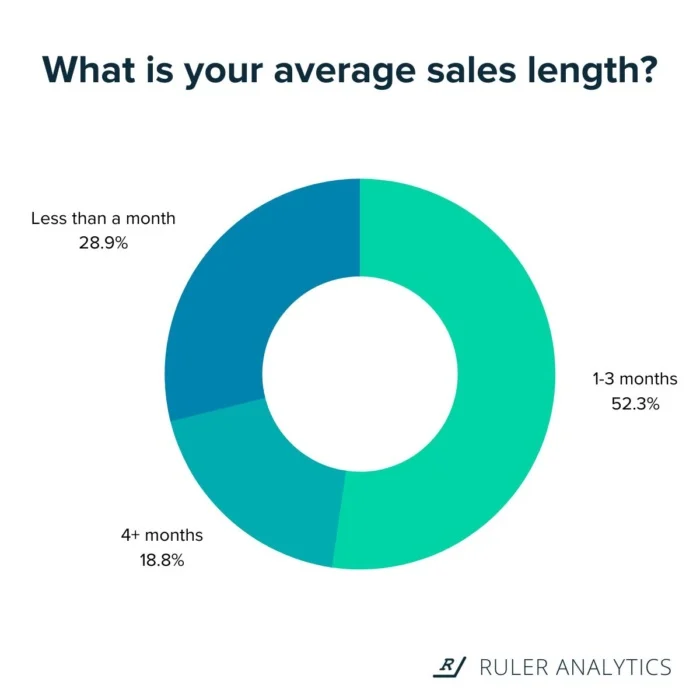
As the graph from Ruler Analytics below shows, the sales cycle can vary considerably, so you’ll probably want to know how you can find detailed data about how long it’s taking your customers to convert.
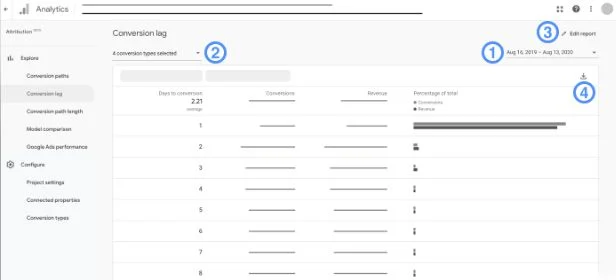
Enter the time lag report in GA4-assisted conversions.
This report shows if conversions take a day or less, a few days, or more. You also get visual graphs for results at a glance.
That’s fantastic news for marketers. Why?
Because you can use this information to nudge your prospect in the right direction. For instance, if a decision takes longer, you might need to do more lead nurturing to get a quicker conversion.
You can also use the report to:
- Target your messaging. If your time lag report shows your buyers are taking their time to buy, sending them informative content like tutorials or frequently asked questions may move them along the sales funnel quicker.
- Discover your quickest converting channels. Do your social channels deliver conversions super-fast? Or perhaps your emails encourage immediate action? When you know your fastest converting channels, you can focus your efforts in that area.
- Keep up with seasonal trends. Are there conversion delays during specific times? Use your GA4-assisted conversions data to find out.
By understanding the time it takes for users to convert, you can fine-tune your strategies and deliver a more tailored and effective experience to your audience.
Interpreting Assisted Conversion Data
All this data is great, but how do you start to make sense of it? Interpreting the data in your reports begins with setting up conversion goals in GA4.
Decide what actions you consider a conversion and set up your goals around them. For instance, a click-through or a sign-up to your app or newsletter. Alternatively, you could start with GA4s predetermined reports such as the Reports snapshot report.
You can also interpret data by:
- Customizing your reports,so they’re the most relevant for your business.
- Configuring “analytics intelligence” for a clearer view of your data that you can act on.
- Choosing the “explorations” option to better understand your buyers and their customer journey.
- Viewing your top conversion path reports. This shows all the paths leading to a conversion. Check that out so you know which channels are proving most effective.
- Looking at your conversion funnels. Are shoppers dropping off along the way? If they’re, what can you do to enhance the customer experience and optimize conversion rates?
- Using the behavioral data under “Audiences” to help you personalize campaigns.
Finally, make use of Google’s GA4 learning center, which is packed full of resources for a better understanding of your analytics.
Leveraging Assisted Conversions for Optimization
Now we know what assisted conversions are and how to interpret GA4s data related to them, let’s delve into how using assisted conversions helps you optimize your online sales strategy:
- Improved ROI Calculation: Assisted conversions help you understand the combined impact of your marketing efforts, leading to a more accurate calculation of your return on investment (ROI) for each channel.
- Avoid Overlooking Key Channels: Some channels might receive few last-click conversions, but they could be vital in initiating the customer journey. Without assisted conversions, these channels might get overlooked, leading to suboptimal marketing strategies.
- Holistic Understanding: You better understand your customer journey from the first touchpoint to the final conversion. This helps you identify which channels play key roles in driving awareness, interest, and purchase intent.
- Channel Optimization: By knowing how different marketing channels contribute to conversions, you can optimize your marketing budget and efforts more effectively. Shift resources to channels that frequently assist conversions.
- Content and Messaging: You can tailor your content and messaging to better suit each marketing channel’s role. For instance, if social media ads often introduce users to your brand, you can focus on creating engaging brand-awareness content for those platforms.
Best Practices for Assisted Conversions Analysis
Want to get the most out of assisted conversions? Then follow these best practices.
- Set up Goals: Choose your goals in GA4 for your store. Doing this allows you to measure the impact of different channels on conversions.
- Customize Assisted Conversions Reports: You could customize your reports in several ways. For instance, consider drilling down the report with more granular groupings like Source/Medium to identify top-performing channels. Alternatively, find the consumers most likely to buy within the next week or so by monitoring your most influential touch points along the customer journey with the top conversion path report.
- Monitor Channel Trends: Keeping a keen eye out for trends helps you to adjust your marketing plan and meet your target audience where they hang out online.
- Analyze Conversion Paths: Take time to understand the top conversion paths report in GA4. Once you know what the typical customer journey looks like, you can optimize your channels.
- View the Bigger Picture: Don’t look at assisted conversions in isolation. Analyze them alongside other metrics like conversion rate, revenue, and ROI.
- Identify Influential Touchpoints: Discover the critical touchpoints that drive conversions. Maybe your social media ads excel at introducing your brand to new audiences, while email campaigns work wonders in converting prospects into paying customers. Use this information to hone your advertising campaigns further.
Case Studies: Real-World Examples
Many top brands are already reaping the benefits of GA4’s assisted conversion reports. By learning how these brands are using assisted conversions, you can adapt their techniques and use them to inspire your strategy.
Here are two case studies that show you how you can use assisted conversions in GA4 for your marketing.
McDonald’s
McDonald’s China wanted to improve its customer experience and increase its in-app food orders. It turned to GA4 to help achieve this.
McDonald’s used the predictive audience future to predict purchase behavior via continually refreshing e-commerce insights.
This enabled McDonald’s to shorten data analysis considerably and allowed the burger chain to see what was working and what wasn’t and how to fix it.
Through the analysis, McDonald’s found that the “likely 7-day purchasers” demographic would deliver the best ROI, so that’s where it focused its paid ads.
The result?
An incredible 550 percent increase in in-app orders and increased revenue of 560 percent for the same customer group.
Claro Shop
The Mexican e-commerce marketplace wanted to stand out against its larger competitors during the country’s annual shopping holiday, Buen Fin.
Claro Shop needed actionable customer insights and the ability to quickly develop relevant ads for its likely audience to make this possible.
Using Google Analytics 4 as its main analytics tool, the online store had access to data from its app and website.
Claro Shop could identify how its apps and e-commerce store worked independently and together from the data. It found that app users were more likely to convert than online shoppers.
From this, Claro Shop used predictive analytics to discover the ideal audience for its seasonal campaign. It selected the “likely 7-day purchases” audience template. Analytics then examined historical data to predict future consumer behavior.
Because of the integration between Google Analytics 4 and Google ads, Claro Shop found it easier to introduce predictive audiences for its ads campaign. It then targeted leads with the “App Campaigns for Engagement” feature.
This allowed Claro Shop to re-engage Android users resulting in a 78 percent decrease in its cost per action, and the numbers of the “likely 7-day purchasers soared.”